
Farm dashboard / AXM Apiary
Your field.
In one
view.
From parcel boundaries
to a plan for every day.
Scroll to see the field change.
01 Geometry and crops
Every
metre has
a purpose.
Cadastral boundaries, crop blocks and a variety catalogue. One map connects the land with everything happening on it.
19 blocks · 4 crops
This scene uses the public dashboard demo geometry. The rows illustrate the structure; they do not represent actual planting.
02 A view from space
Spot the
difference.
Sentinel-2 imagery helps compare vegetation across blocks and dates, alongside 30 years of climate data for the site.
Colour shows a block's average NDVI from an archived image. It can prompt a field check; the index does not identify causes or prescribe irrigation.
03 Irrigation and fertigation
Water,
as planned.
From the reservoir through the mains to 31 zones. Two weeks of irrigation on the project map: as days pass, the pump supplies each crop in turn.
Raspberry · zones: 3 · 60.97 m³/h
Design schedule from the dashboard. Valve control follows once the equipment is connected.
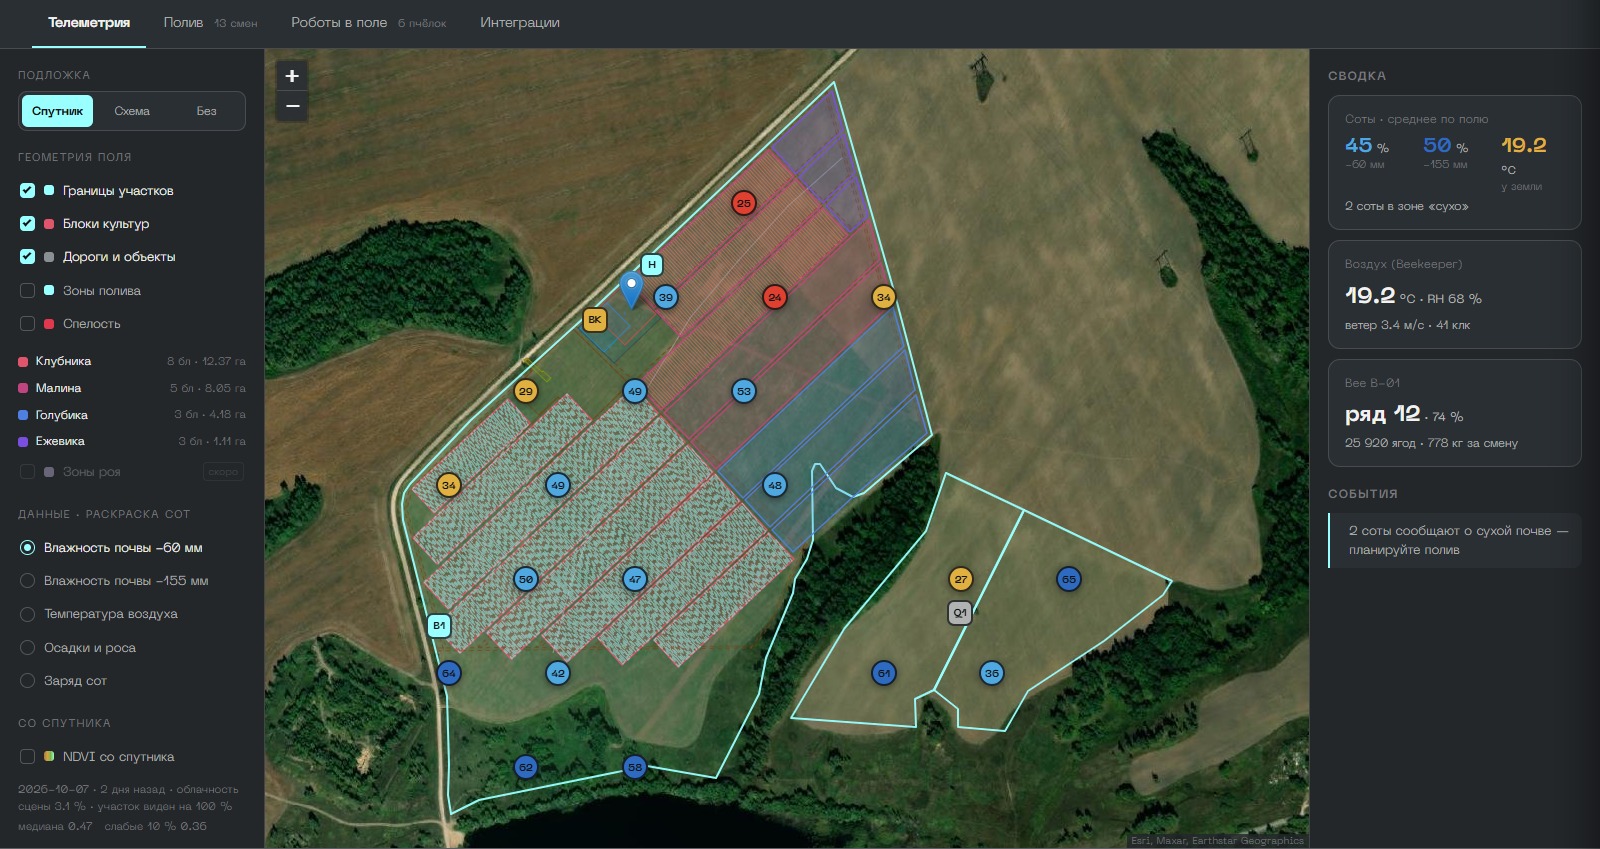
04 Telemetry
Read the
field.
Soil moisture at two depths, air, rainfall and sensor battery levels. The map shows where; the chart shows how readings change.
The interface is ready; these readings are synthetic. Field sensors and a gateway still need to be connected.
05 Robots in the field
First,
simulate a day.
Harvesting with grading, weeding, mowing, spraying and snow clearing — by block and work window. Simulate peak-harvest capacity and fleet workload for 14 days.
Illustrative row traversal · demonstration
This animation illustrates the idea. Workload calculations are in the dashboard; no field robots are connected yet.
06 Team and decisions
Data at hand.
The decision
is yours.
Register with confirmation in a messenger and build a team with roles and permissions. The agronomist has the plan and recipes. Each task has parameters, deadlines and sign-off.
Apiary brings the context together for people. Physical commands require connected equipment and a separately confirmed workflow.
Explore the dashboard07 Ready to explore
Now,
your field.
Open the demo without signing up. Or create your own project: add land, crops and your team.
Open the demo Create your project Discuss a rollout on your farmMap · satellite · irrigation plan · tasks
Telemetry and machinery operate in demo mode.